
Source Code Visualizer
The Source Code Visualizer is where the results of a source-code scan are explored. Where the rest of the platform inventories cryptography that is deployed, this page works at the level of the code that implements it: which cryptographic calls a repository makes, on which line of which file, through which library, and how risky each one is.
It is reached from Insights > Source Code Visualizer in the left navigation menu, and needs the source-code-visualizer:access permission.
The page views scans; it does not run them. Scans are produced by the SourceCode Discovery sensor — add it to a Template, run that template as a Task, and the resulting scan becomes available here. See Sensors Reference for the sensor's own settings.
Choosing a Scan
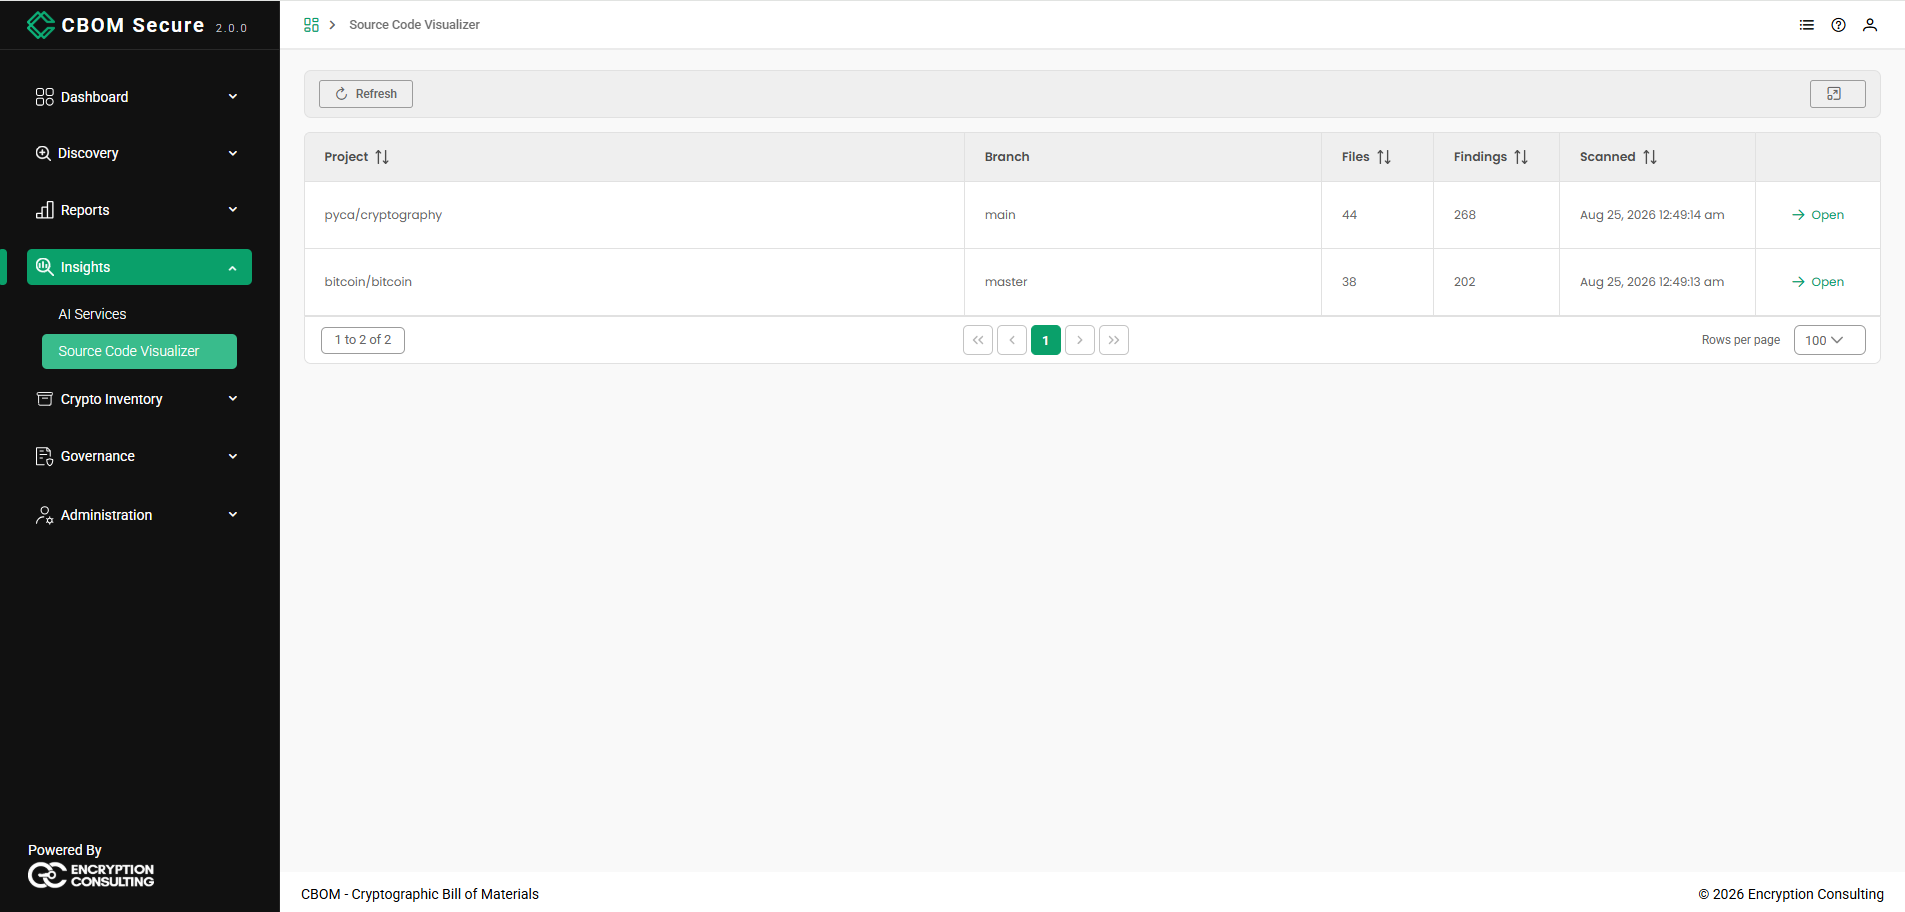
The page opens on a list of the scans available in the inventory, newest first. Refresh reloads the list, and the button on the right expands the table to full screen.
-
Project: The repository the scan covers.
-
Branch: The branch that was scanned.
-
Files: How many files contained cryptographic material.
-
Findings: How many individual cryptographic calls were found across those files.
-
Scanned: When the scan ran.
-
Open: Opens the scan in the visualizer.
Project, Files, Findings and Scanned are sortable. The footer carries the same controls as every other table in the portal — record range on the left, page links in the centre, Rows per page on the right.
The Scan Header
Once a scan is open, a header identifies it: the project name, the scan ID, the branch, and when the scan ran. The Scan button at the right returns you to the list to choose another scan — it does not start a new one.
Below that sits a row of counts: the findings at each severity, then the file and finding totals. Severities run Critical, High, Medium, Low and Safe, and only the severities actually present are shown. Each severity count is clickable and filters the scan to those findings, so the header doubles as a way in.
The header and the counts stay in place as you move between tabs, so the scan you are looking at is never in doubt.
The Eight Views
A scan is presented through eight tabs. They show the same findings from different angles rather than different data, so a finding located in one view can be followed into another.
Overview
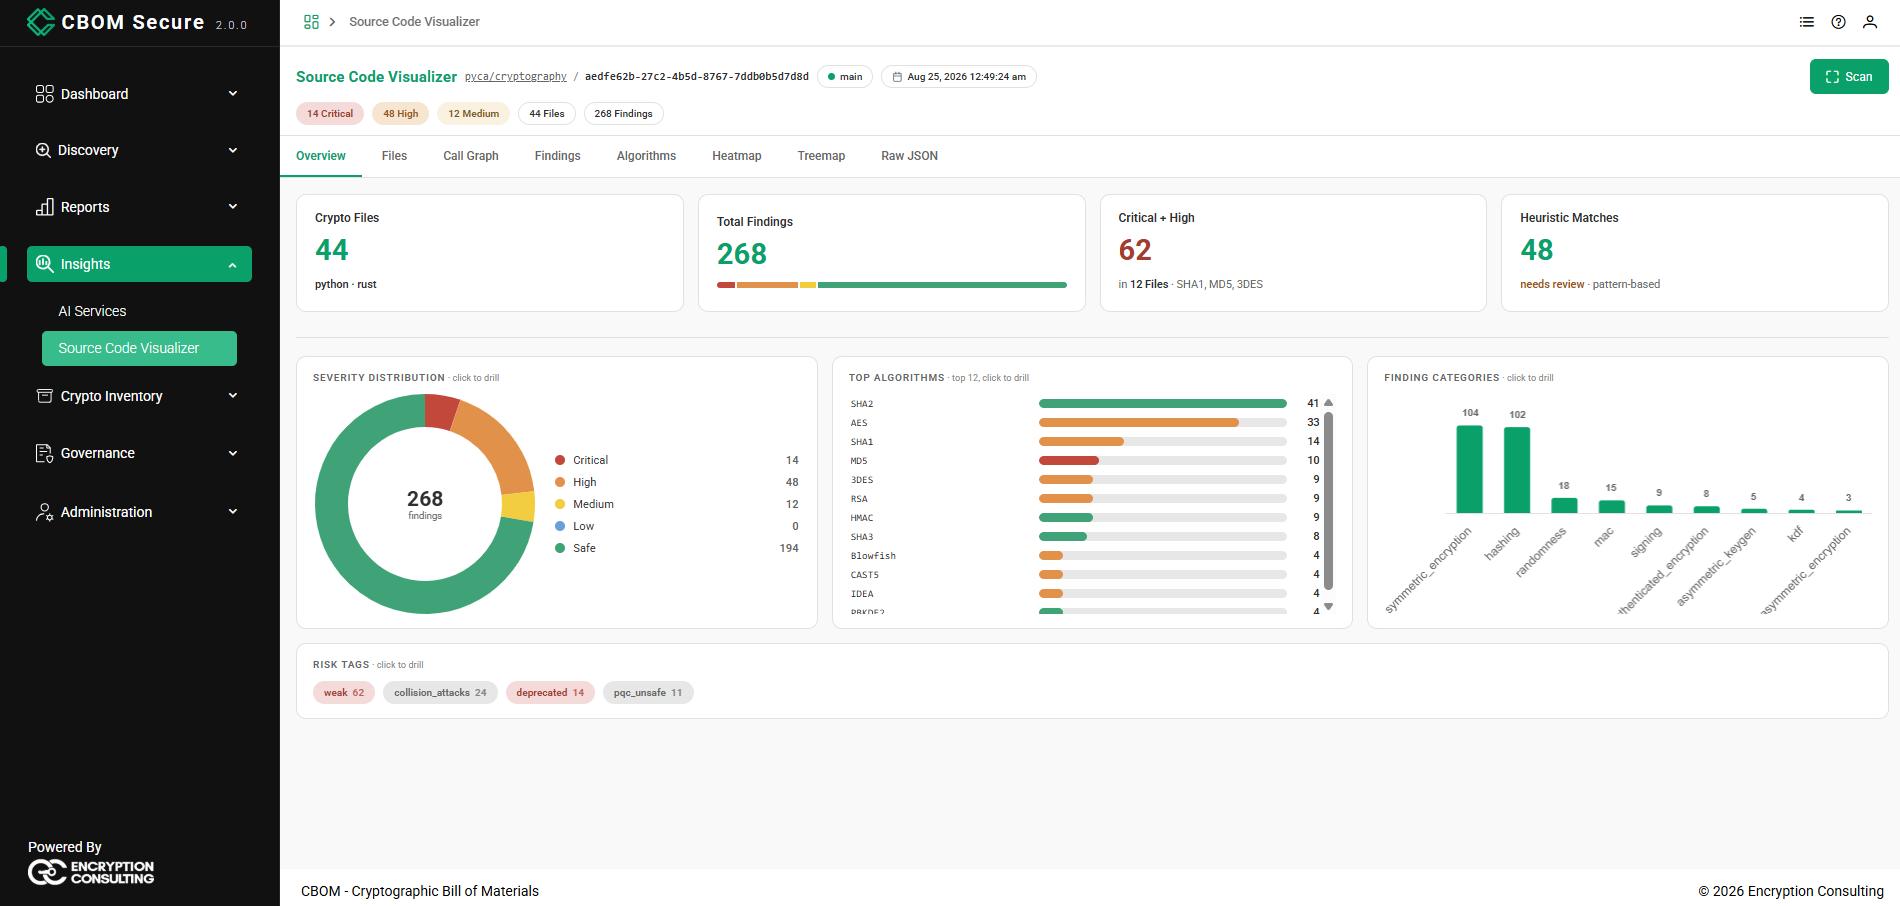
The summary view. Four cards give the headline figures — Crypto Files (with the languages involved), Total Findings, Critical + High (with the files and algorithms behind it) and Heuristic Matches (pattern-based detections that need review).
Beneath them, Severity Distribution breaks the findings down as a doughnut, Top Algorithms ranks the algorithms by usage, and Finding Categories groups them by what the cryptography is for — symmetric_encryption, hashing, randomness, mac, signing, authenticated_encryption, asymmetric_keygen, kdf and so on. A Risk Tags row closes the tab with counts per tag, such as weak, collision_attacks, deprecated and pqc_unsafe.
Every chart here is marked click to drill: clicking a segment, bar or tag narrows the scan to those findings.
Files
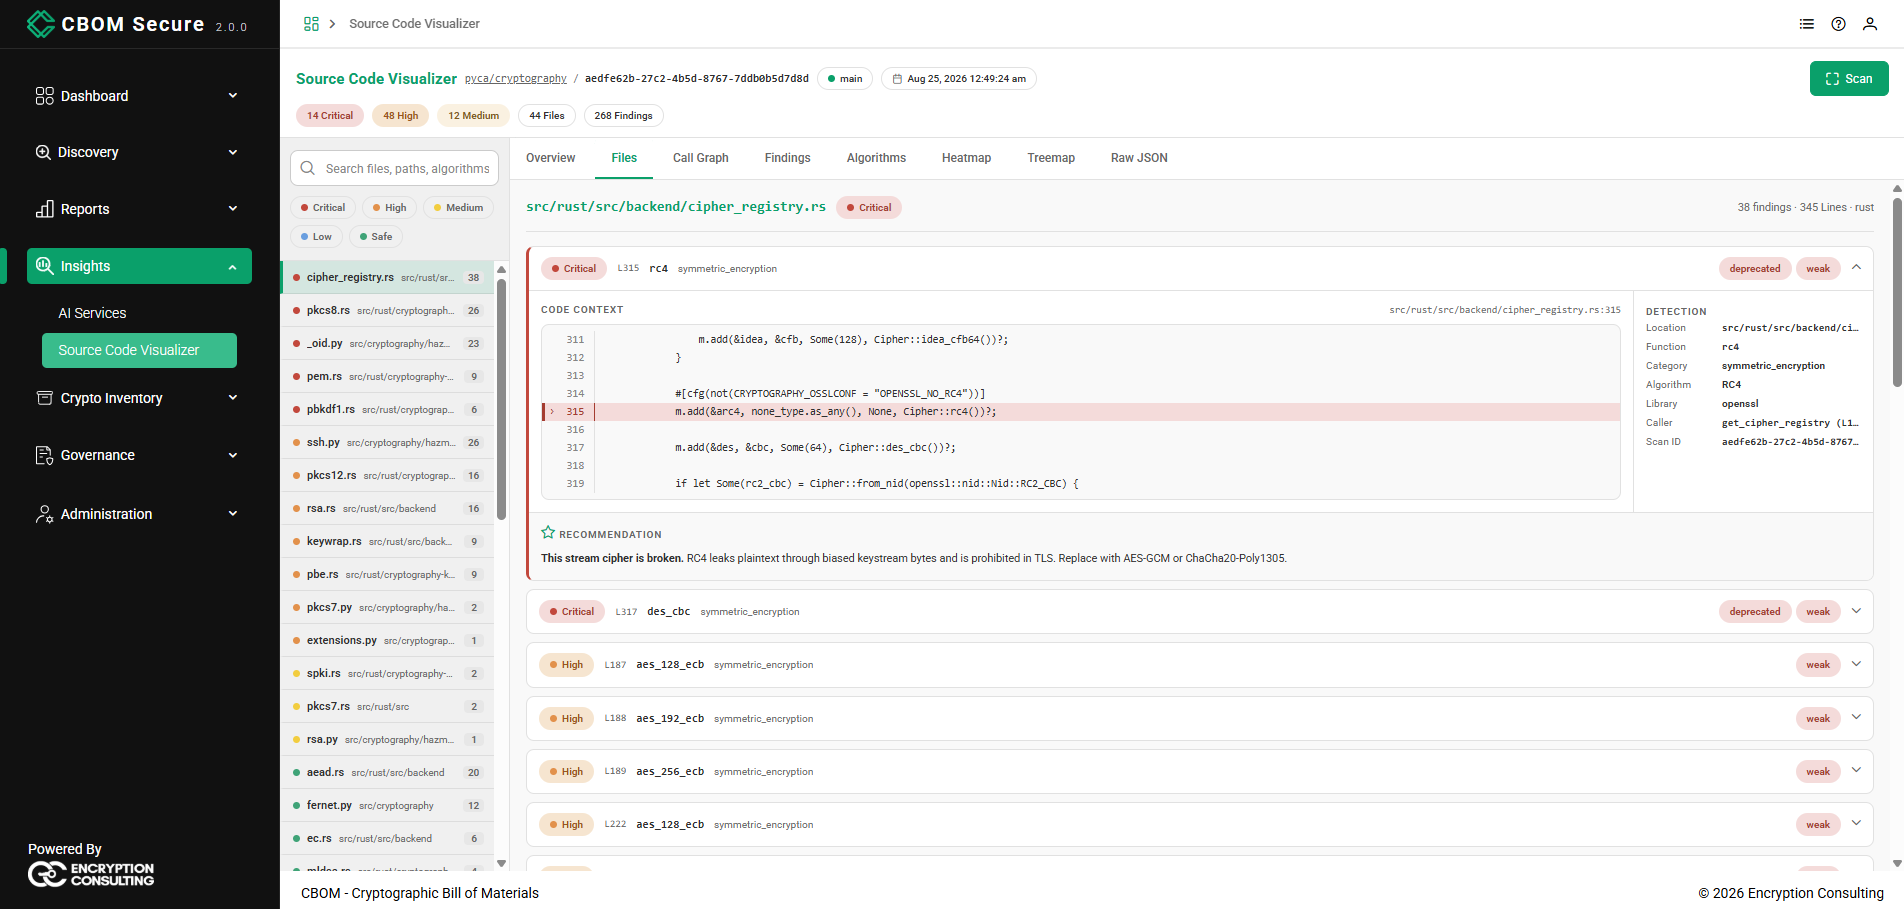
The file-by-file view. A sidebar lists every file that contains cryptographic material, with a Search files, paths, algorithms box, severity filter chips, and a finding count per file. Selecting a file shows its findings on the right, each one expandable.
An expanded finding gives three things: the Code Context — the surrounding source with the offending line highlighted; a Detection panel naming the location, function, category, algorithm, library, caller and scan ID; and a Recommendation explaining why the finding matters and what to use instead.
Call Graph
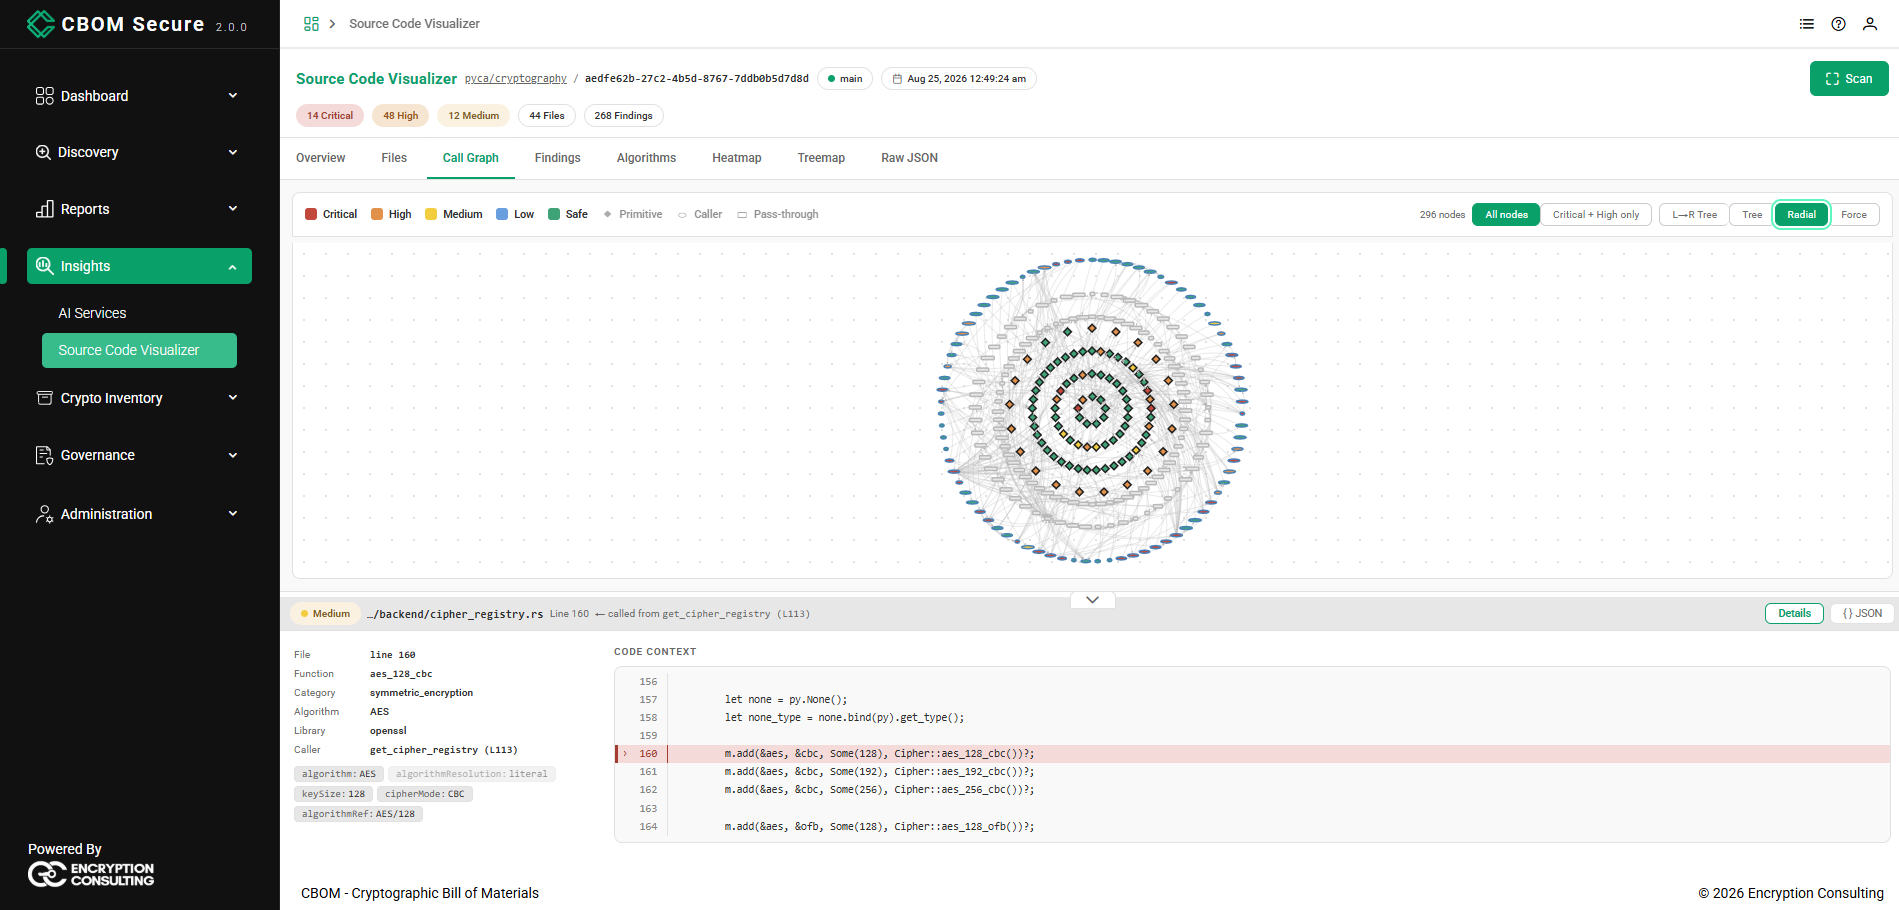
Shows how the cryptographic calls connect. Nodes are coloured by severity and shaped by role — a diamond for a Primitive, an ellipse for a Caller, a rectangle for a Pass-through — so colour and shape carry severity and role independently.
The controls above the graph report the node count and offer All nodes or Critical + High only, and four layouts: L→R Tree, Tree, Radial and Force. Selecting a node opens the detail drawer described below.
Findings
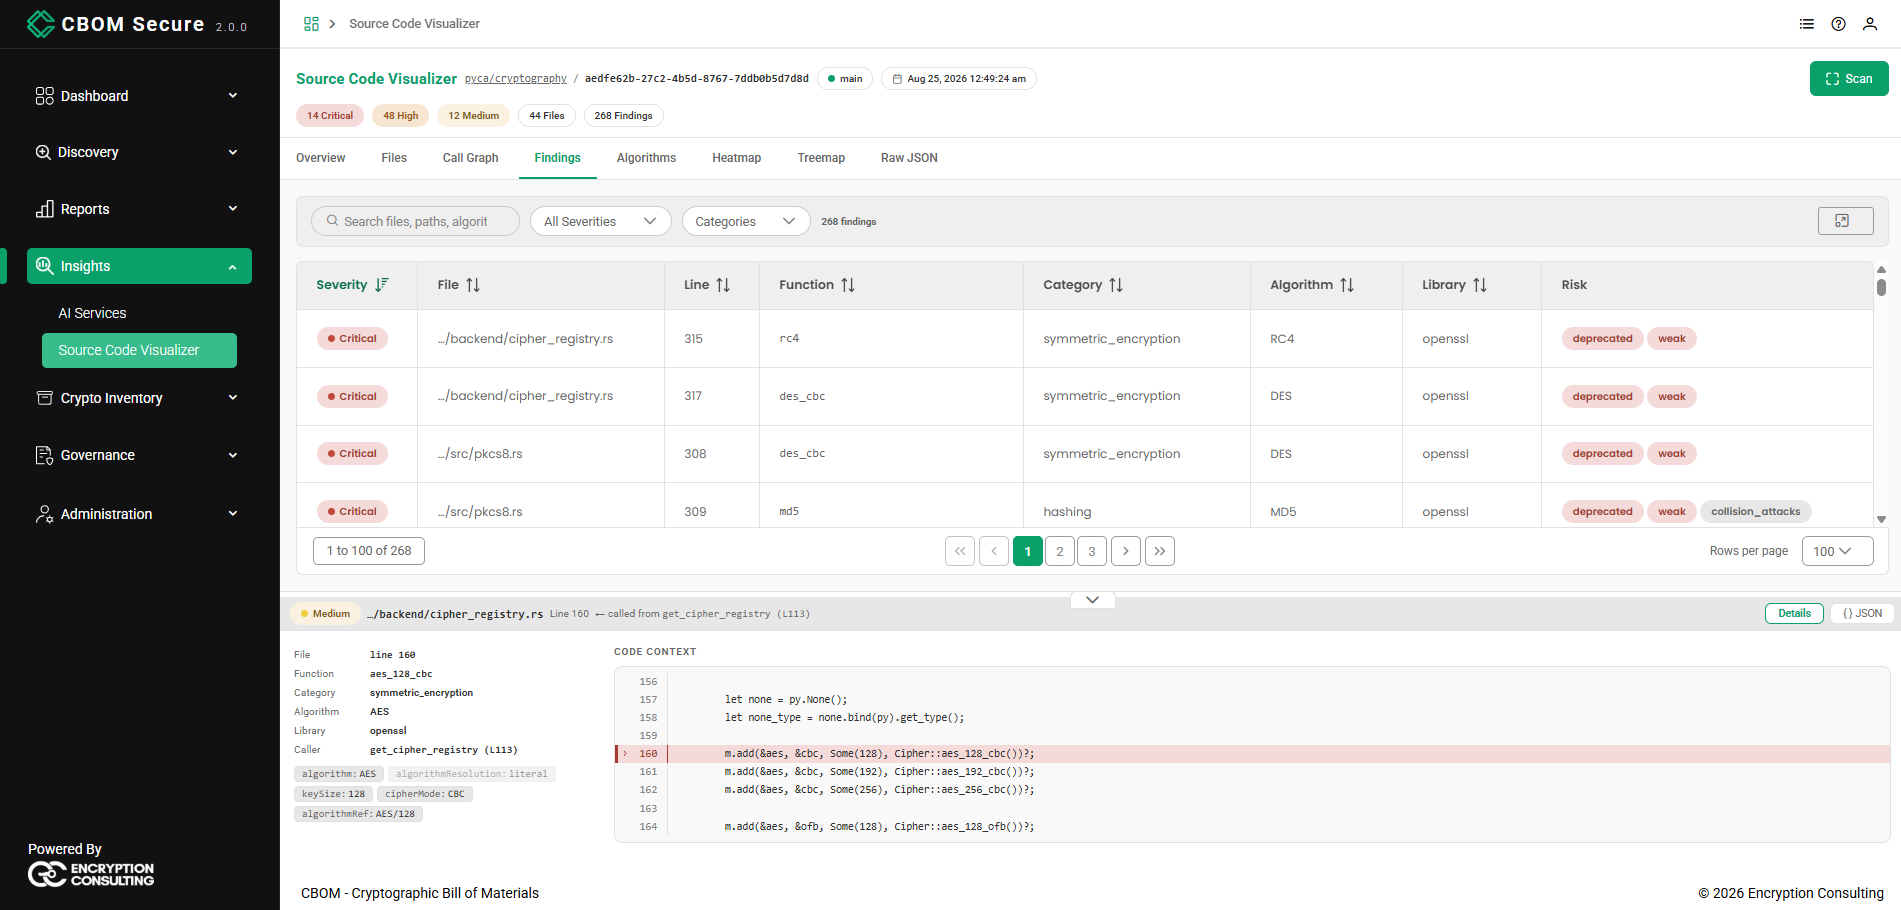
Every finding in the scan as one sortable table: Severity, File, Line, Function, Category, Algorithm, Library and Risk (the risk tags on that finding). Above it are a search box, an All Severities dropdown, a Categories picker and the current finding count.
This is the view to use when you want to work through findings in order of severity rather than by file. It is paginated with the standard table footer.
Algorithms
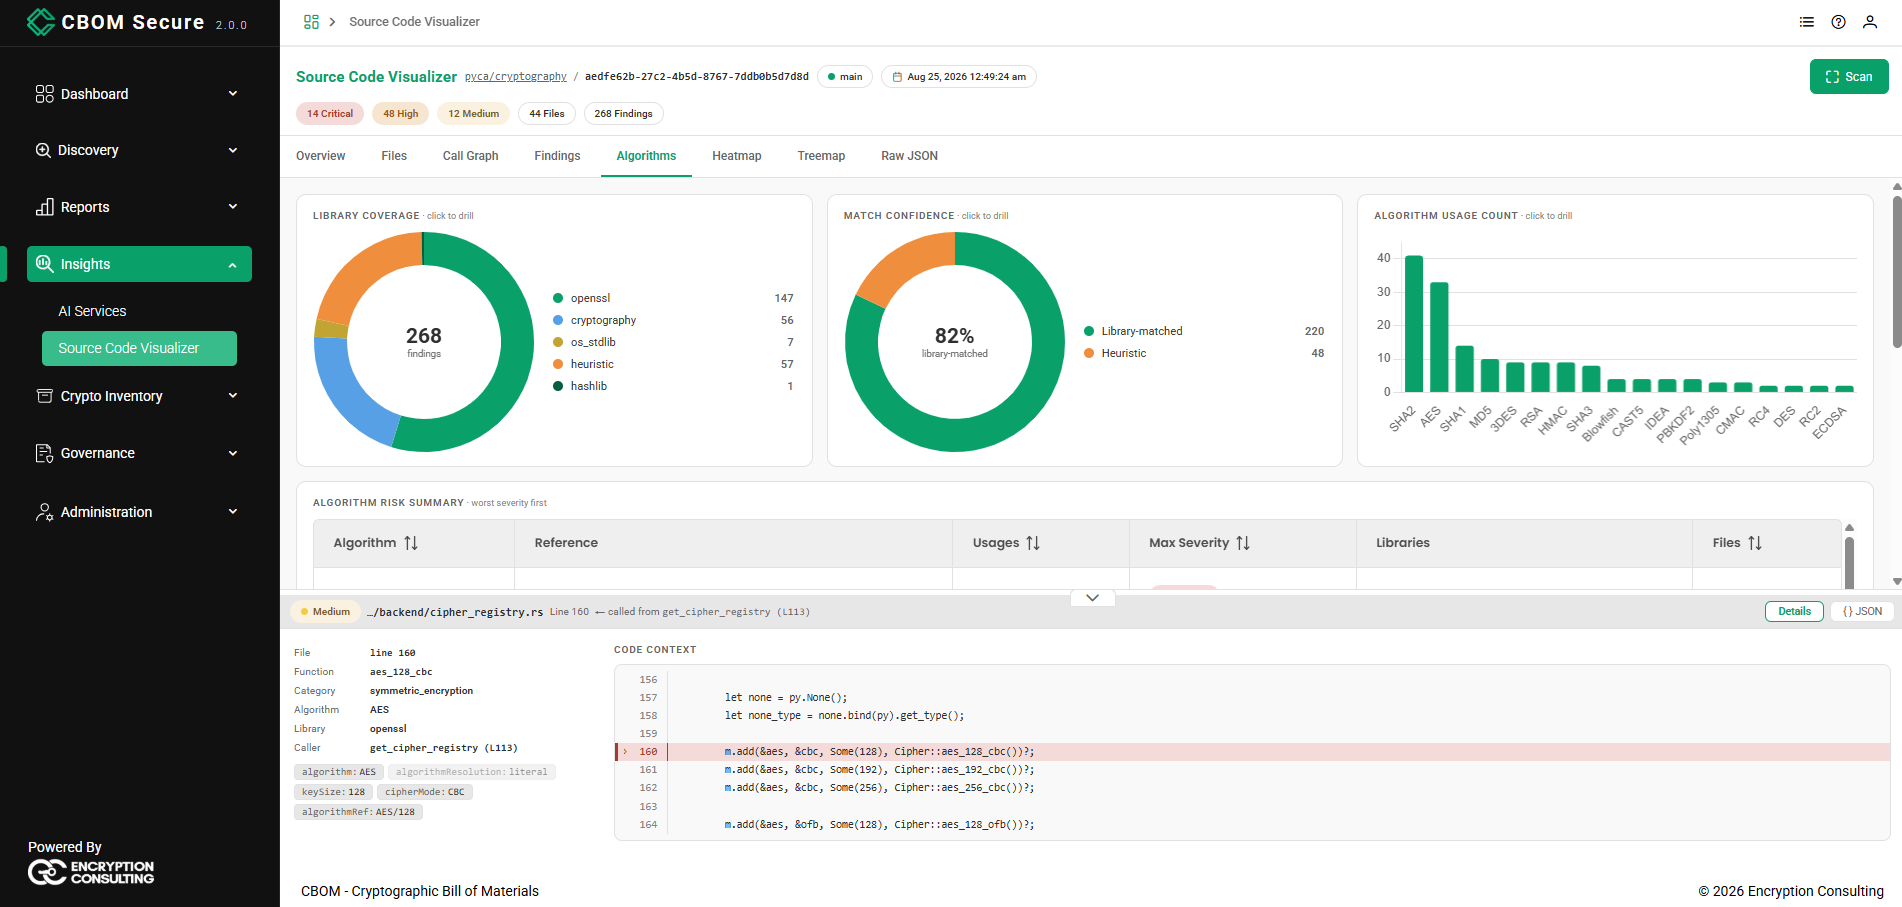
The algorithm-centred view. Library Coverage splits the findings by the library that provided the cryptography, Match Confidence shows what share was matched to a known library rather than inferred by heuristic, and Algorithm Usage Count ranks the algorithms.
An Algorithm Risk Summary table follows, worst severity first, listing each algorithm with its Reference, Usages, Max Severity, Libraries and Files. Use this tab to answer “which algorithms are in this codebase, and which of them should not be”.
Heatmap
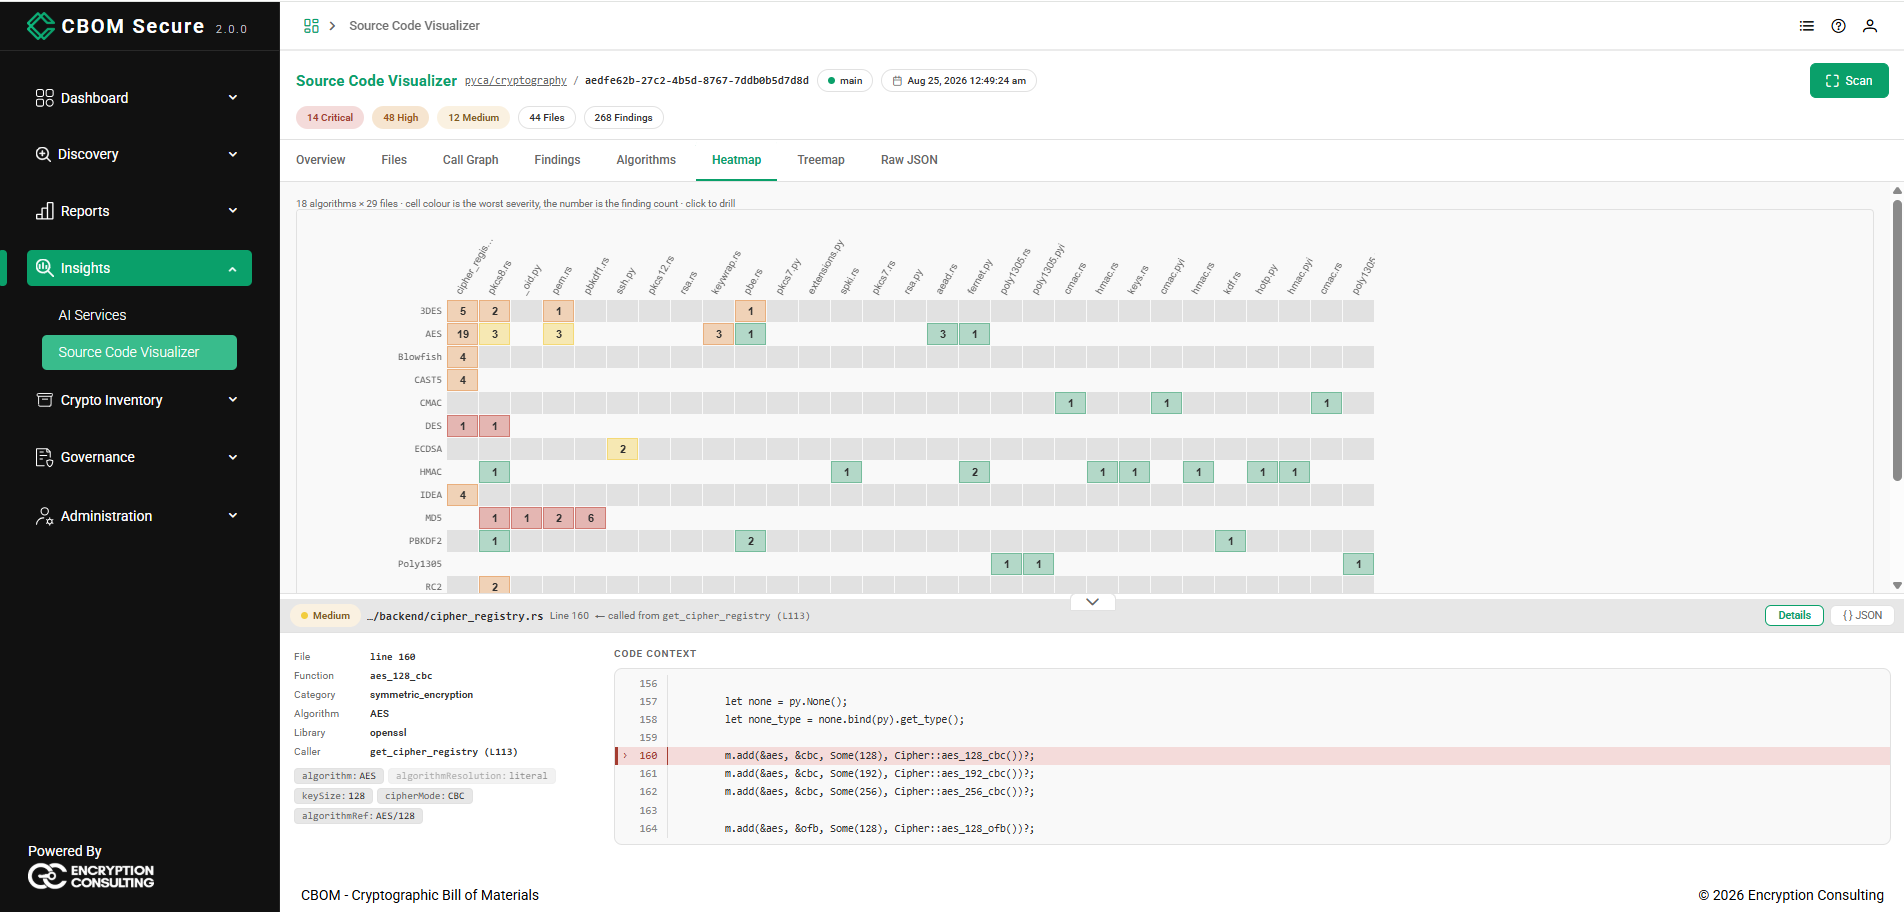
A grid of algorithms against files. Each cell holds the finding count for that pairing and is coloured by the worst severity found there, so concentrations stand out — a row that is red across several files is an algorithm used badly in many places. Clicking a cell drills into it.
Treemap
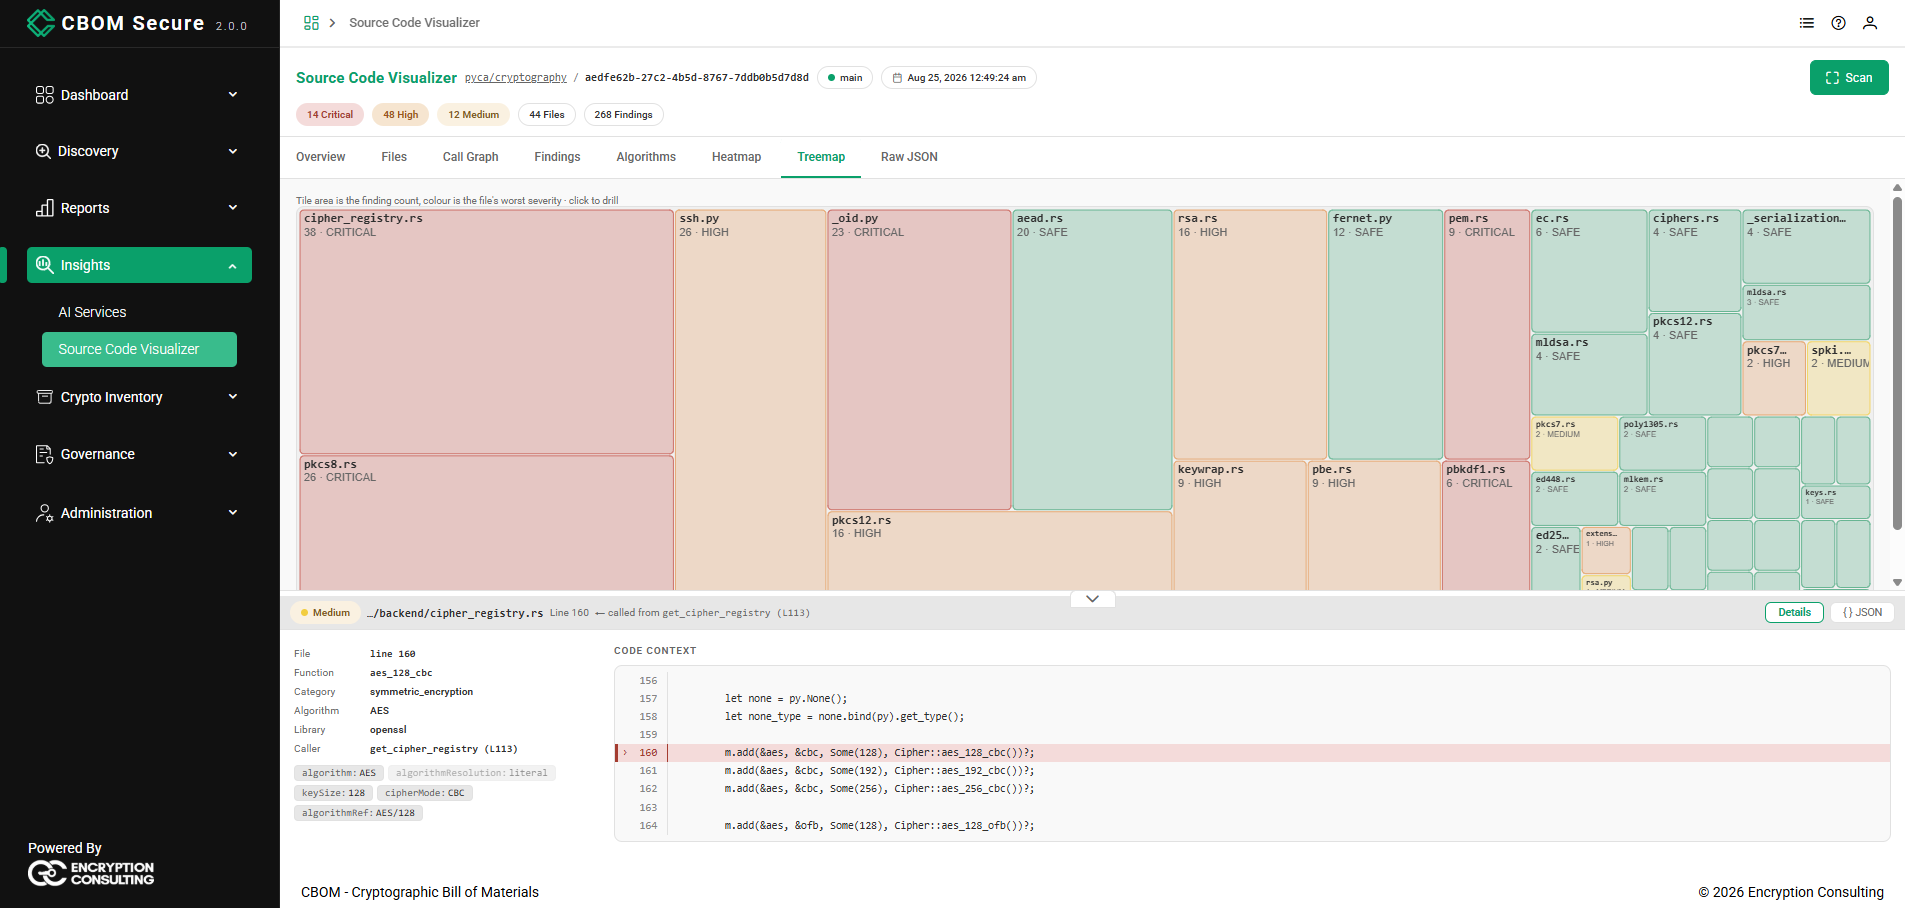
The same findings sized by volume. Each tile is a file: its area is the finding count and its colour the file's worst severity, which makes the files carrying the most cryptographic risk the largest and reddest. Clicking a tile drills into that file.
Raw JSON
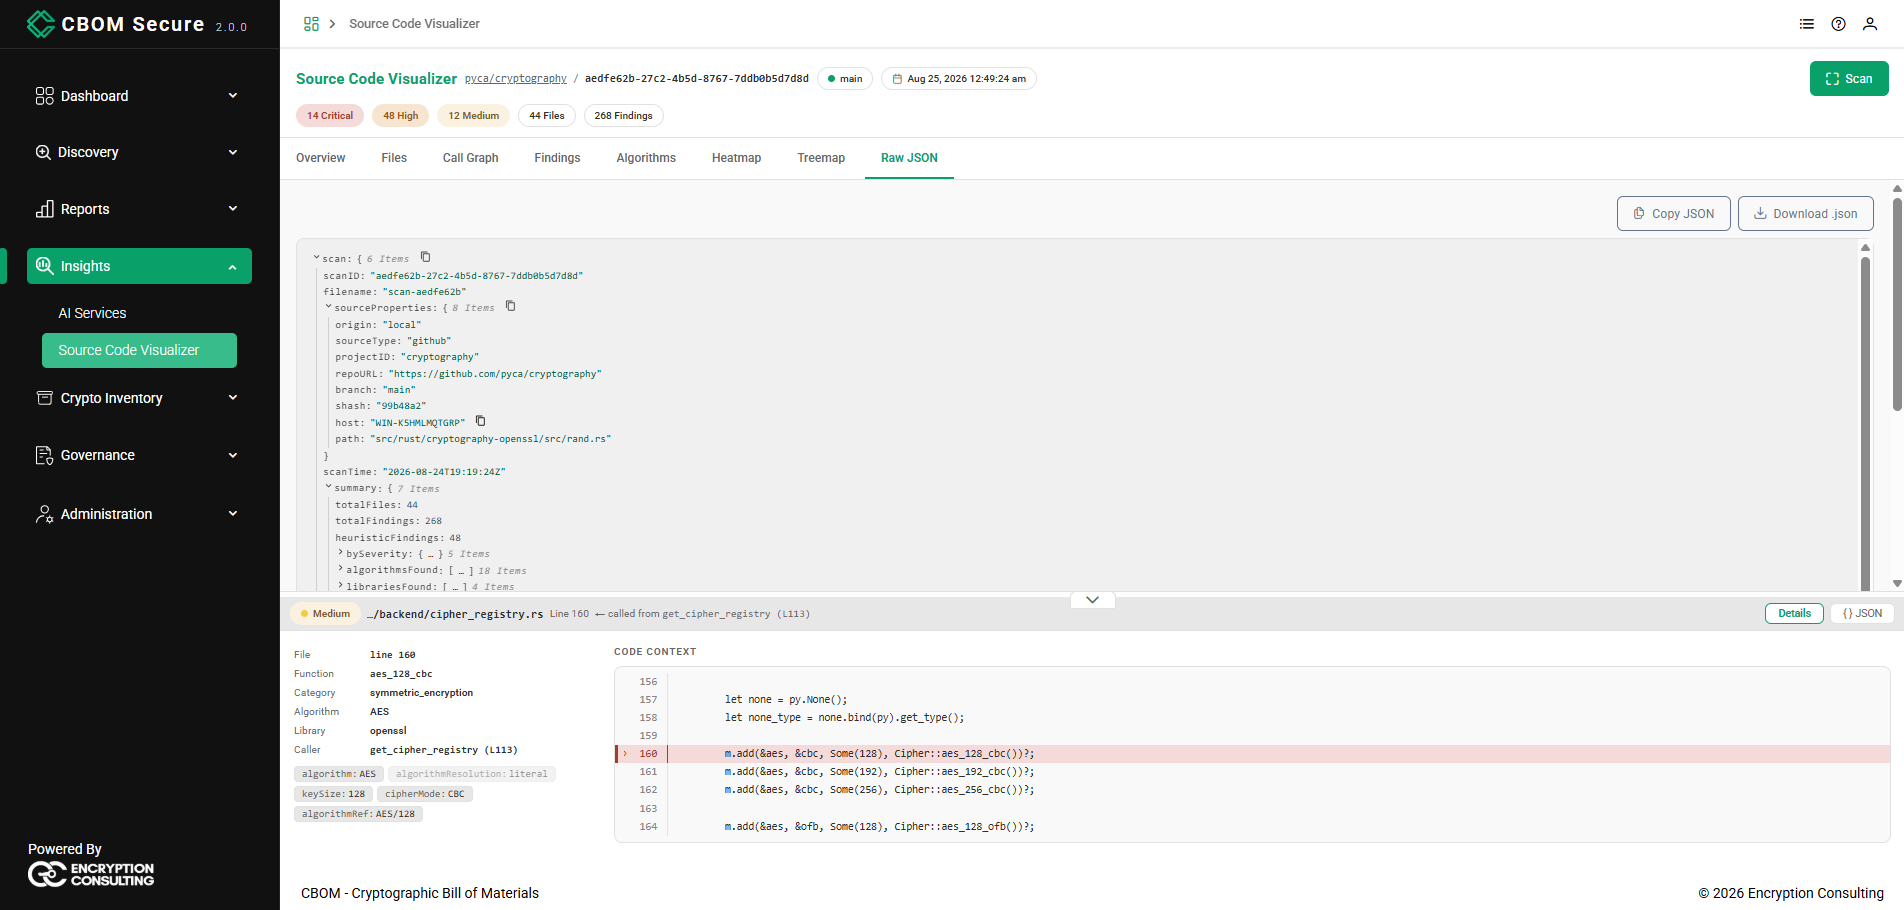
The scan exactly as the platform stored it, as an expandable tree — scan ID, source properties (origin, source type, project, repository URL, branch, commit hash, host and path), scan time and the summary counts, then the findings themselves.
Copy JSON puts the document on the clipboard and Download .json saves it to a file. A large scan is not rendered until you ask for it: the tab offers a Render JSON button showing the approximate size, so a very large document cannot slow the page down unless you want it on screen.
The Finding Detail Drawer
A drawer at the foot of the page shows whichever finding is currently selected, and is shared by the Call Graph, Findings, Algorithms, Heatmap and Treemap tabs — so selecting a node, a row, a cell or a tile fills the same panel. Use the chevron on its top edge to collapse or expand it.
The drawer names the finding's severity, file and line, and which function called it. Details lists the File, Function, Category, Algorithm, Library and Caller, followed by the resolved properties as chips — for example algorithm: AES, keySize: 128, cipherMode: CBC and algorithmRef: AES/128, with algorithmResolution recording whether the algorithm was read literally from the code or inferred. Beside it, Code Context shows the source around the finding with the line highlighted.
The { } JSON toggle swaps the same finding for its raw record, which is useful when you need a field the formatted view does not show.