
System Logs
System Logs brings every service's logs into one place: the CBOM Server, the Collector and its worker, the AI Service and the Discovery Server. It answers is it working? for an operator. The Audit Trail beside it answers who did what? for a reviewer.
The page is reached from Administration > System Logs in the left navigation menu. It is available to administrators, managers and auditors.
Viewing Logs
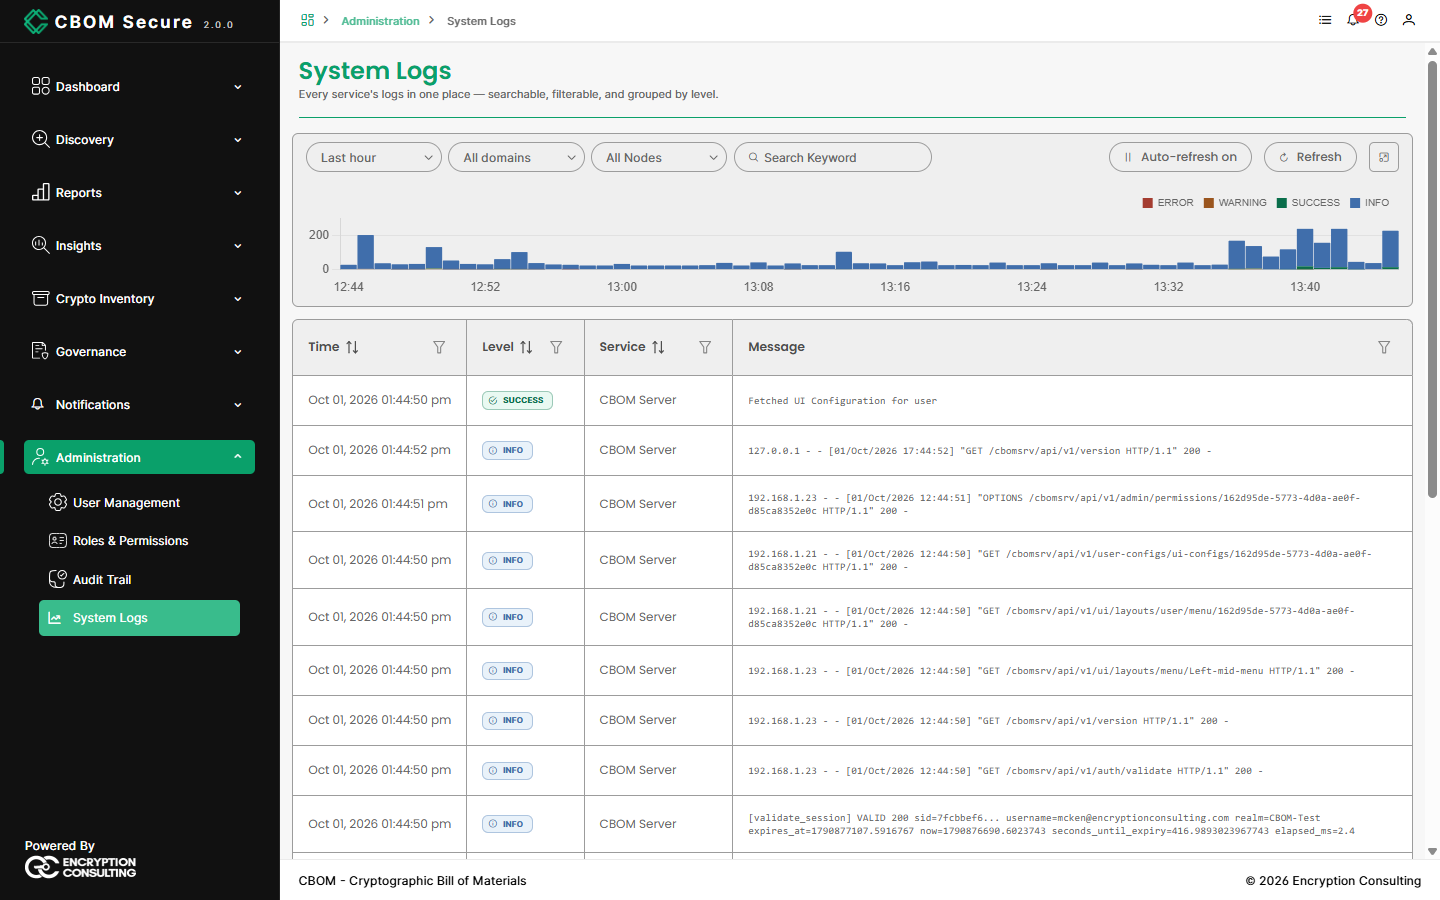
The filter bar narrows what is shown:
Time range: The last 15 minutes, hour (the default), 6 hours, 24 hours or 7 days.
Domain: The area of the product a line belongs to, such as authentication, hosts or ingestion.
Node: Which server produced it. Shown only when more than one server reports.
Search Keyword: Matches text in the message.
The chart counts lines over the chosen range, coloured by level (ERROR, WARNING, SUCCESS, INFO). A burst of red is usually the quickest way to find when something went wrong.
The table lists each line's Time, Level, Service and Message, and each column can be filtered. Levels run from DEBUG and INFO through SUCCESS and WARNING to ERROR and CRITICAL.
Auto-refresh is on by default and fetches new lines every 30 seconds. It pauses while the browser tab is hidden. Click it to pause manually, or use Refresh for a one-off update.
Viewing a Log Record
Click any line to open the full record:
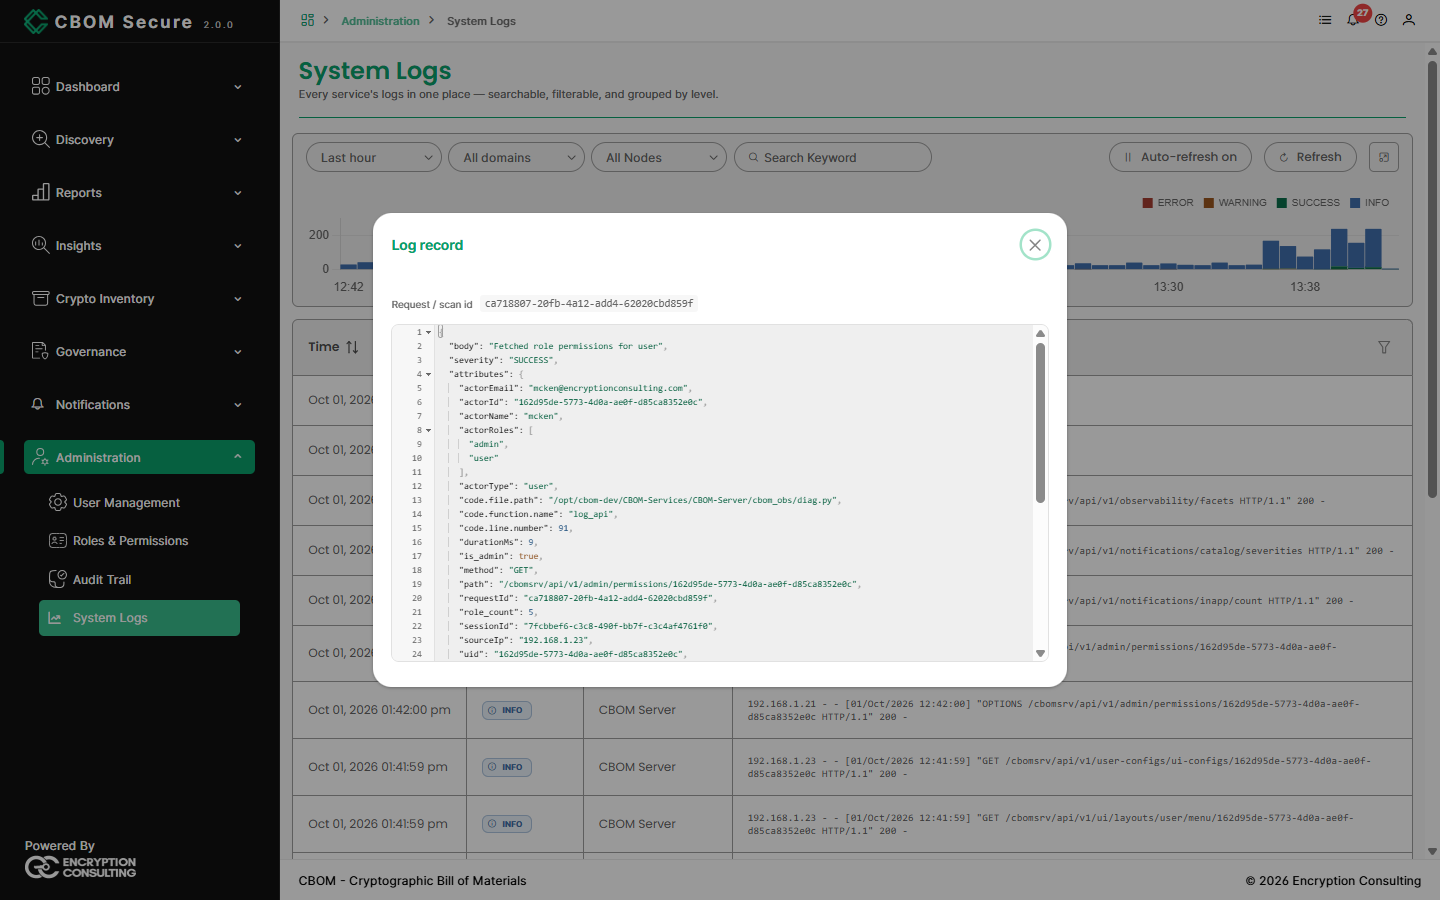
The record shows every field the service wrote. Its Request / scan id links it to the other lines from the same request or scan, and to the matching Audit Trail record. Search for that id to follow one request or one scan from start to finish.