
Data Visualization
Every visual element on a CBOM Secure dashboard is a widget, and every widget can be resized, repositioned and restyled. This page describes the families of visualisation the widget library offers, so you can tell which kind of widget to reach for. The exact figures on your own dashboard depend on what discovery has found in your environment.
KPI Single Value Grids
A KPI grid presents a set of single-number metrics side by side — totals such as keys, certificates or cipher suites discovered, and counts broken down by a property such as key storage or certificate validity. The grid is one widget, so its width, height and styling are set once for the whole block rather than per number.
KPI grids are the usual top row of a dashboard: they answer “how much of each thing do I have?” before the charts below break the same totals down. Several of the pages in this guide open with one — see Key, Certificate and CipherSuites.
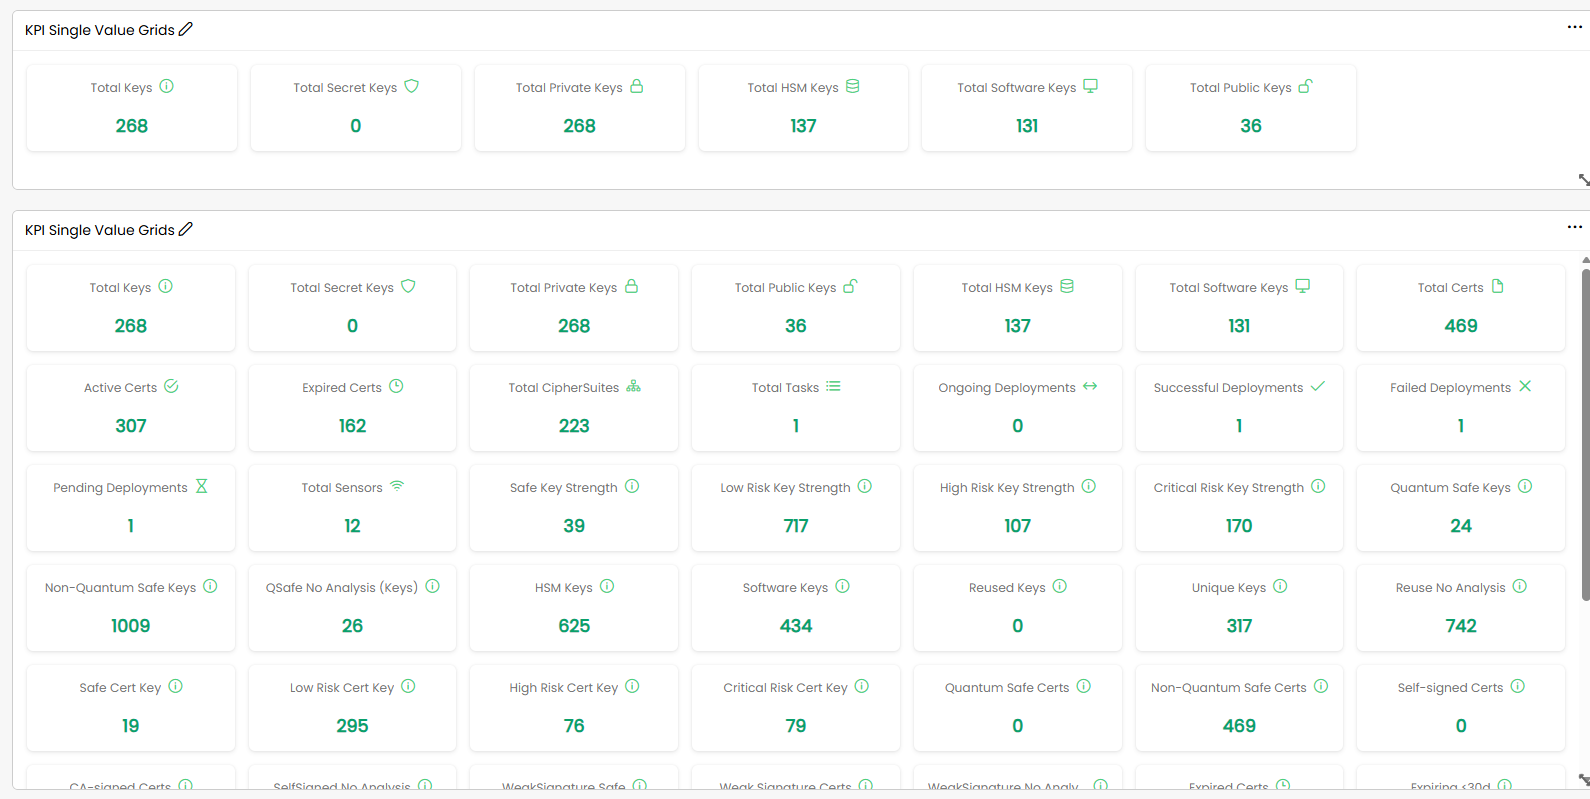
Chart Widgets
Chart widgets plot a count against a grouping. The most common form is a bar chart over buckets — for example certificates grouped by how soon they expire (1–30 days, 31–60 days, 61–90 days, 91–120 days) — but the same widget family also covers charts grouped by algorithm, key type, host or sensor.
Charts are interactive: clicking a bar drills into what it represents, either into a narrower chart or into a table of the underlying documents. The drill-down carries your current selection with it, so the table you land on holds exactly the records behind the bar you clicked.
-
Grouped and stacked charts: Show two dimensions at once — a grouping across the axis and a second breakdown within each column, such as compliant against non-compliant material per host.
-
Line and time-series charts: Plot a measure over time rather than across categories, for tracking how risk or policy compliance moves between two dates. See Analysis for the time-series widgets.
-
Multi-chart widgets: Hold several related charts in one frame, so a single widget covers a whole topic — the post-quantum widgets on the PQC Report work this way.
Percentage Indicators
Percentage indicators are gauge-style widgets showing one proportion each, and are usually placed in a row so the set adds up to the whole population. They suit compliance rates, adoption rates and distribution across a handful of buckets, where the share matters more than the raw count.
Table Widgets
Table widgets list the underlying documents rather than aggregating them, and are where a chart drill-down usually ends. They carry the same footer controls as every other table in the portal: the record range on the left, the page links in the centre, and a Rows per page selector on the right offering 10, 20, 50 or 100 rows.
Two variants go further than a plain list: a mixed table combines per-row detail with a summary column, and a document-detail widget shows one selected record in full instead of a list.
Text and Detail Widgets
Not every widget plots data. A text widget holds free-form notes on the dashboard itself — useful for labelling a section or recording what a layout is for — and detail widgets render a single cryptographic material document, or its change history, for inspection alongside the charts that led you to it.