
PQC Report
This layout can be customised. The page below describes it as shipped. To adapt it for a specific purpose, build the arrangement you want as a template in Dashboard > Home — adding, removing, arranging and configuring widgets — then choose Update > Save as Layout and pick this page. Saving replaces this page's layout for every user and the previous arrangement is not kept, so it needs the layout-update permission held by administrators. See Publishing a Template as a Layout.
The PQC Report is the platform's general quantum cryptography analysis report. It focuses on post-quantum readiness, highlighting which keys, certificates, and cipher suites are quantum-safe versus vulnerable, and scoring the organization's overall crypto-agility. The report is organized as a single scrolling layout combining KPI cards, charts, and a host-level agility breakdown. It is reached from Reports > PQC Report in the left navigation menu, and the shipped layout is named PQC-Report-Layout.
The report is a read-only layout: the dashboard toolbar's Refresh, Update and Add Widgets controls are not shown here. An Export PDF button at the top right renders the whole report to a PDF named after the layout — see Exporting the Report.
KPI Single Value Grids
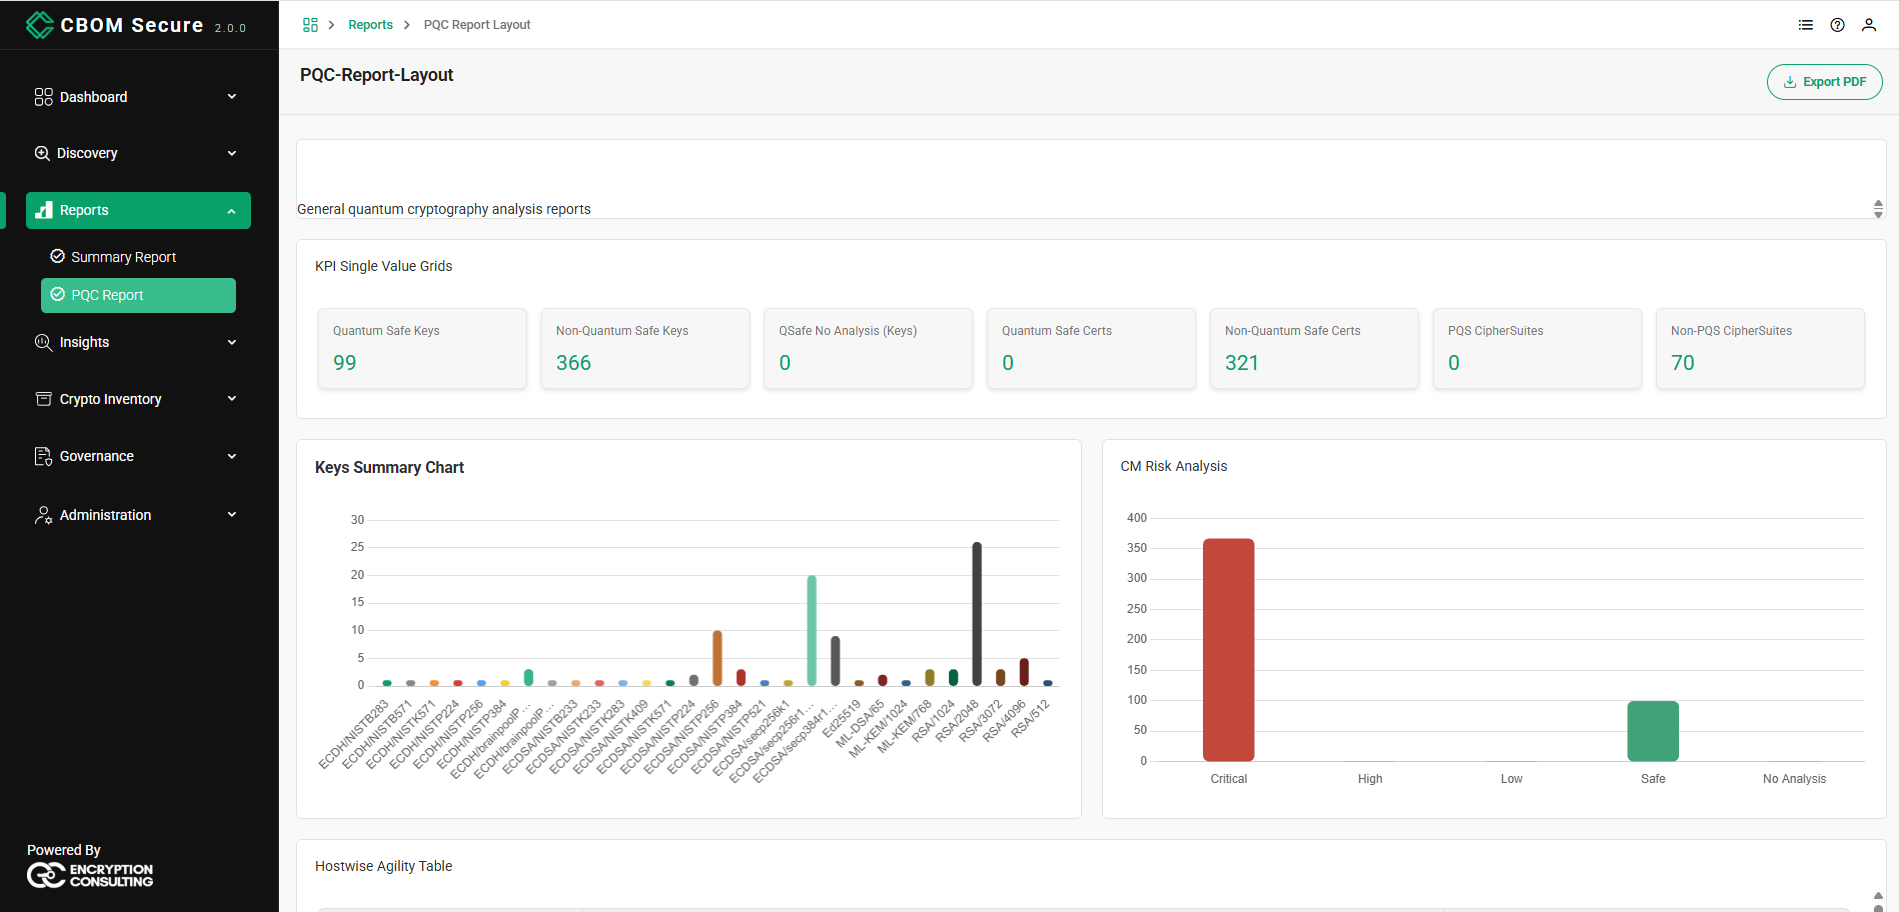
The report opens with a row of single-value cards summarizing the quantum-readiness of the inventory at a glance:
Quantum Safe Keys
Non-Quantum Safe Keys
QSafe No Analysis (Keys)
Quantum Safe Certs
Non-Quantum Safe Certs
PQS CipherSuites
-
Non-PQS CipherSuites
Summary Charts
Below the KPI cards, two charts visualize the inventory and its risk profile:
-
Keys Summary Chart: One bar per algorithm and key size, so the post-quantum families sit alongside the classical ones — ECDH/NISTB283 through ECDSA/secp384r1, Ed25519, ML-DSA/65, ML-KEM/1024, and RSA/1024 through RSA/4096.
-
CM Risk Analysis: A breakdown of cryptographic material by risk severity — Critical, High, Low, Safe, and No Analysis.
Hostwise Agility Table
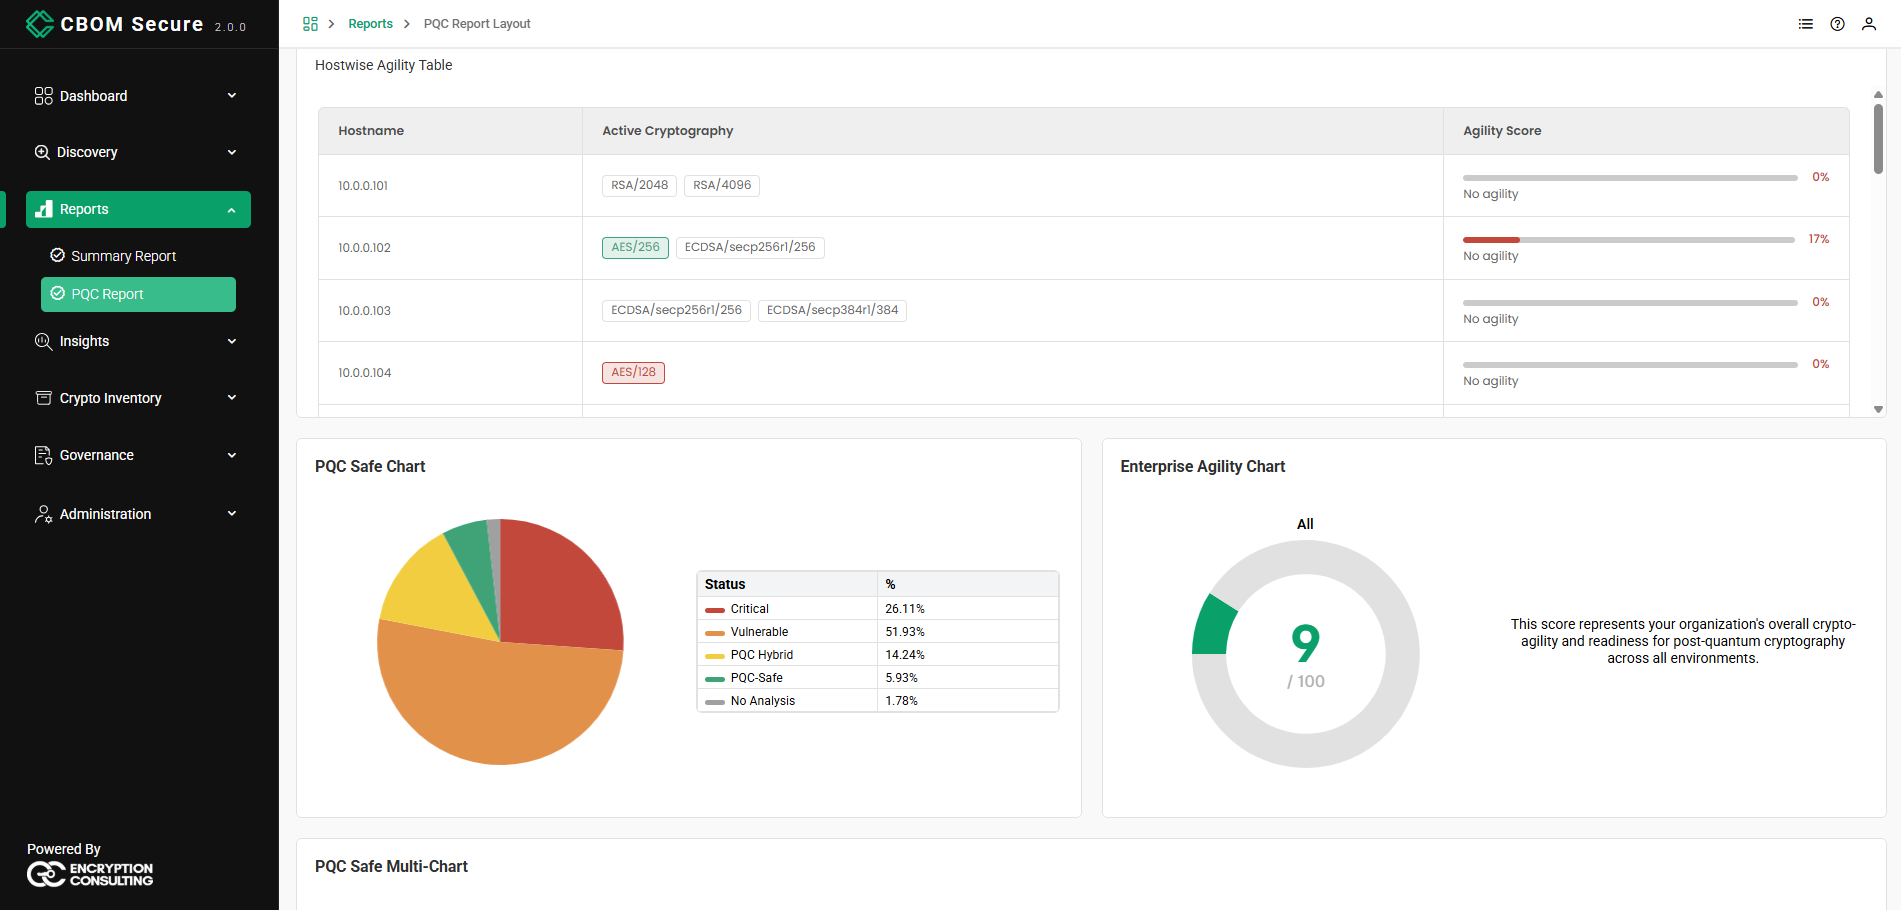
The Hostwise Agility Table breaks down crypto-agility on a per-host basis. Each row lists the Hostname, its Active Cryptography (the algorithms in use, such as AES/256, RSA/4096, or ECDSA/NISTP256), and an Agility Score shown as a progress bar with a descriptive label. The score is computed from every distinct algorithm present on the host, not just the two shown in the column, and falls into one of four bands:
81–100: High crypto-agility
51–80: Partial crypto-agility
31–50: Low crypto-agility
0–30: No agility
A host running only classical algorithms scores 0% — No agility; the algorithm chips are colour-coded to the same judgement, so AES/256 reads green where AES/128 reads red.
PQC Safe Chart
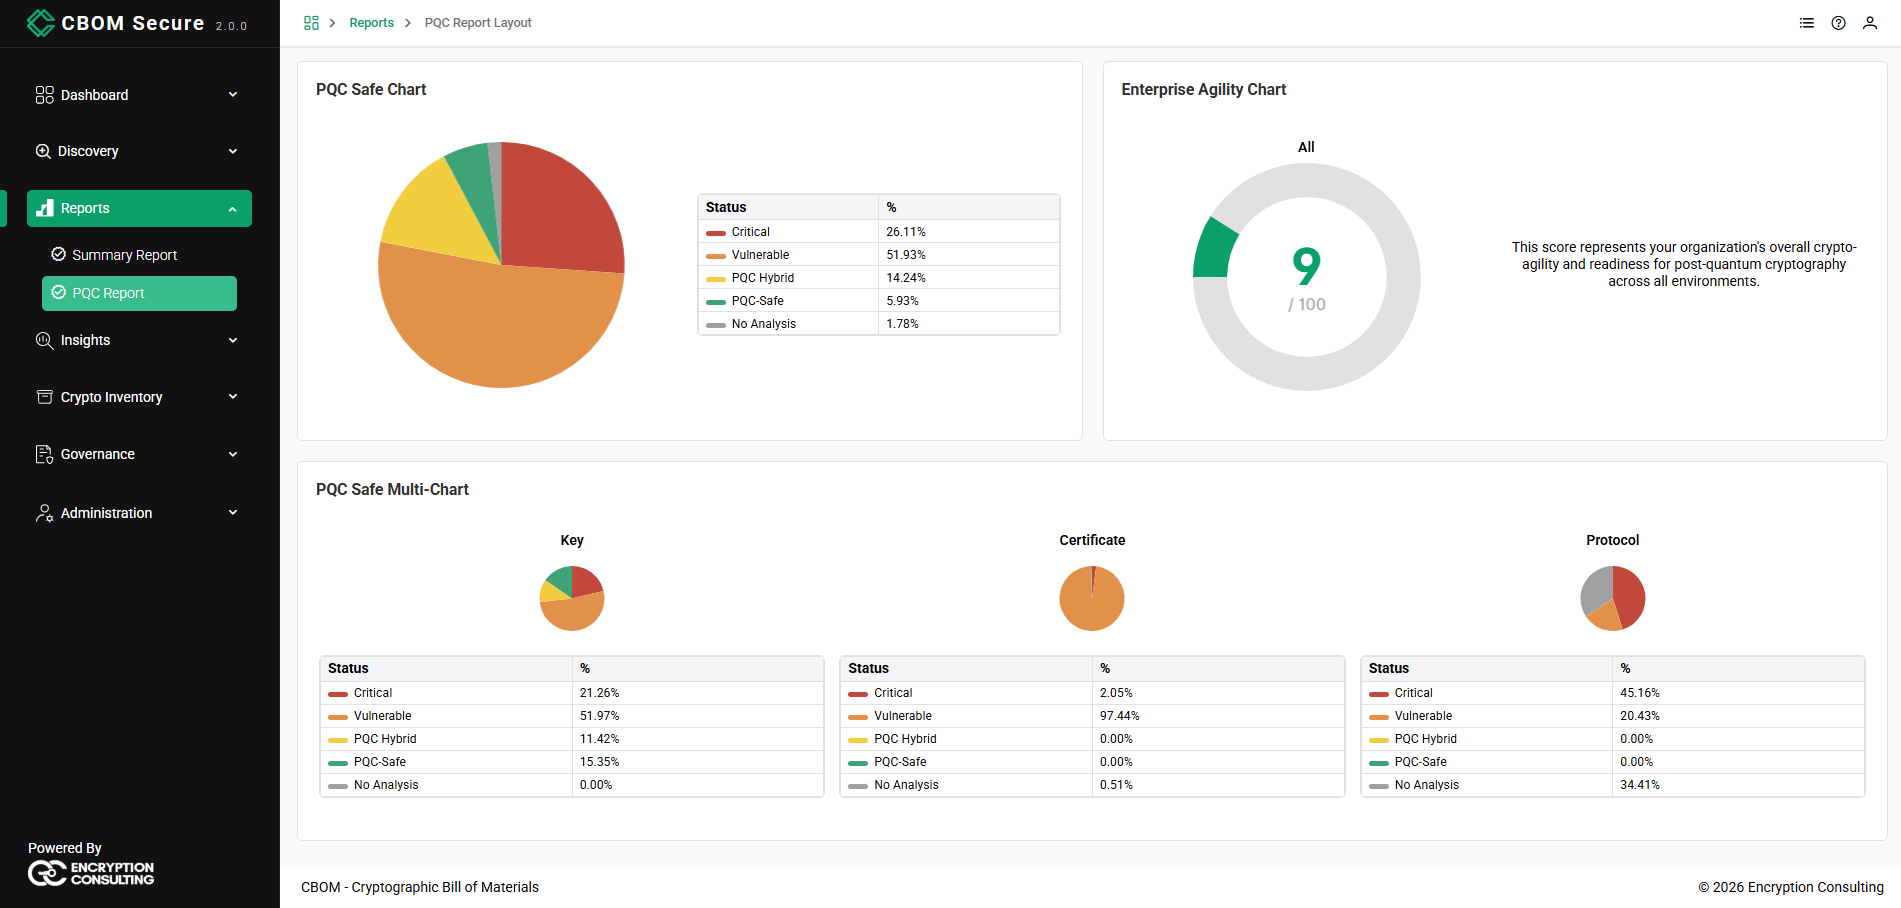
The PQC Safe Chart presents the overall post-quantum safety of the inventory as a pie chart with an accompanying status breakdown. Each status is shown with its percentage of the total — Critical, Vulnerable, PQC Hybrid, PQC-Safe, and No Analysis.
Enterprise Agility Chart
The Enterprise Agility Chart reduces the organization's crypto-agility to a single score out of 100, drawn as a doughnut with the score in the middle and the scope it covers above it — All for the whole estate. It is the average of the per-host scores in the Hostwise Agility Table, so a low number here is explained row by row in that table.
PQC Safe Multi-Chart
The PQC Safe Multi-Chart breaks down post-quantum safety by asset type, presenting three pie charts side by side — Key, Certificate, and Protocol. Each chart is accompanied by a status table showing the percentage of that asset type in each state: Critical, Vulnerable, PQC Hybrid, PQC-Safe, and No Analysis. This makes it easy to compare quantum readiness across keys, certificates, and protocols at a glance.